Case study
What could be simpler than making microwave popcorn? Unfortunately, as everyone who has ever made popcorn knows, it’s nearly impossible to get every kernel of corn to pop. Often a considerable number of inedible “bullets” (un-popped kernels) remain at the bottom of the bag. What causes this loss of popcorn yield? In this case study, three factors were identified:
1. Diameter of bowls to contain the corn, 10 cm and 15 cm
2. Microwaving time, 4 minutes and 6 minutes
3. Power setting of microwave, 75% and 100%
8 runs were performed with 100 grams of corn used in every experiments and the measured variable is the amount of “bullets” formed in grams and data collected are shown below:
Factor A= diameter
Factor B= microwaving time
Factor C= power
Run order | A | B | C | Bullets (grams) |
1 | + | – | – | 3.94 |
2 | - | + | – | 2.94 |
3 | – | - | + | 0.74 |
4 | + | + | - | 1.94 |
5 | + | – | + | 0.95 |
6 | + | + | + | 0.32 |
7 | – | + | + | 0.94 |
8 | – | - | - | 3.12 |
Using full factorial method
1. Key in average for all 8 runs. *the data given is in run order and not run no. so input the values to the excel sheet accordingly.


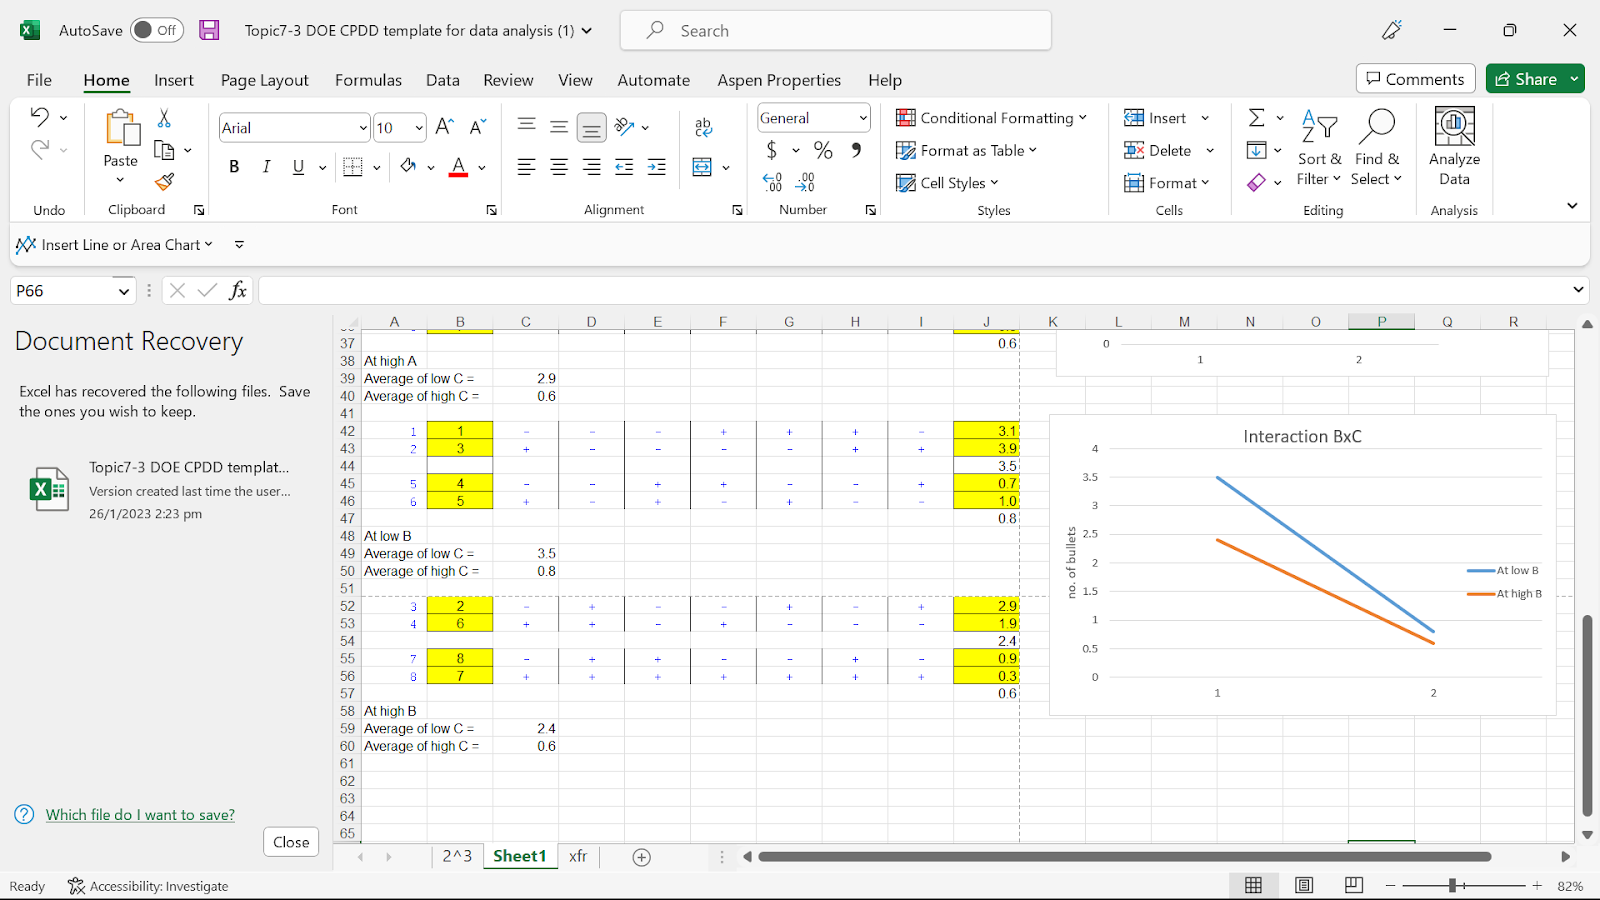


Studying the graphs, factor C is the most significant as it has the most negative gradient. Whereas factor A is the least significant as it has the least negative gradient. From most significant to least - C, B, A.


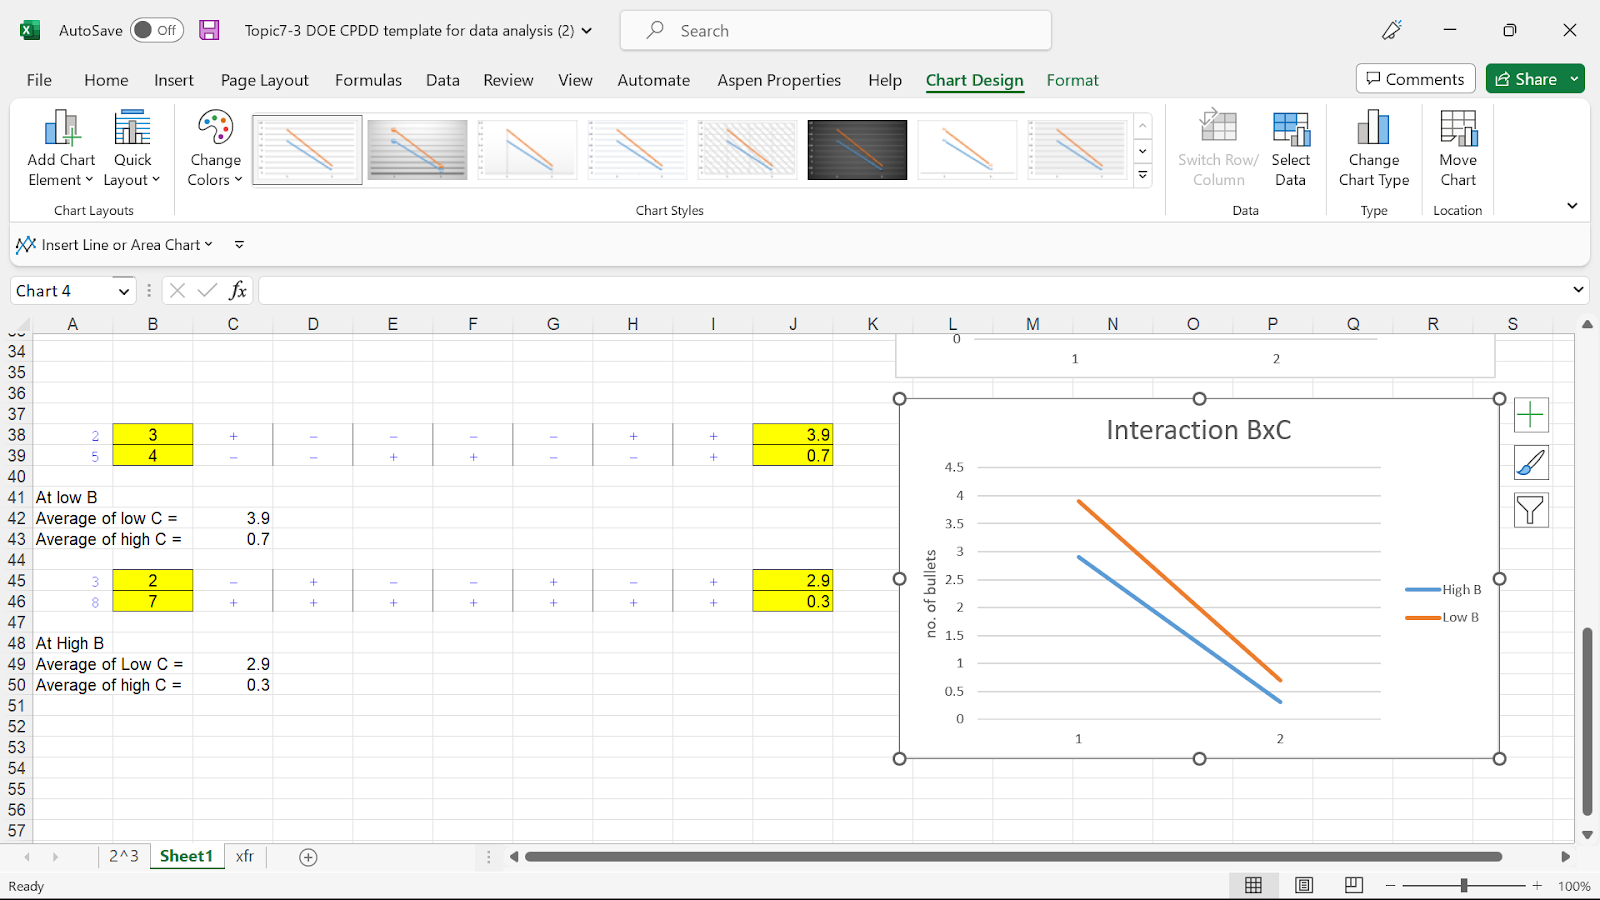
From the graphs of interaction, it can be seen that the most significant interaction is A and B as they have the largest difference in gradient. It can also be seen that the least significant interaction is B and C as it has the least difference in gradient.
Link to full factorial (excel): Full factorial final .xlsx
Link to fractional factorial (excel): Topic7-3 DOE CPDD template for data analysis (2).xlsx
Link to images (full and fractional): https://drive.google.com/drive/folders/1sGD0G40oyiCAPPaeDj2vYK3iDRYD38N7?usp=share_link
Reflection
The latest lesson on the Design of Experiments (DOE) focuses on achieving accurate experimental results efficiently.
To achieve accurate experimental results, it often uses all experiment data and runs before plotting the relevant graphs to compare the results. However, using DOE, a fractional factorial method of an experiment can be carried out and only a few relevant runs are needed to provide similar results compared to the traditional, full factorial method. This method can be used to study the effects of different factors set at various levels.
From the case study carried out, it can be concluded that although both methods show the same most significant and least significant factor, there are differences in the analysis of the interaction of the factors. In the full factorial method, A and C interaction is the least whereas, in the fractional factorial method, B and C are the least. Hence, it can be seen that using the fractional factorial method is not as accurate as running a full factorial method. Additionally, my group and I faced similar problems when we ran our practical using the catapult. We had similar outcomes from both methods, but the significance of interactions differed resulting in a different outcome compared to the full factorial method.
However, as much as the outcomes of both methods differ, we can also conclude that the factorial method is enough to provide results similar to the full factorial method and would be a more feasible and efficient method if an experiment with multiple replicates is carried out. However, it also shows that using the fractional factorial method may not be as accurate as compared to the full factorial method which shows a more obvious gradient, representing a significant relationship. Hence, it is important to select the right data/run# that is balanced and varied so as to obtain a more accurate and correct result when carrying out the fractional factorial method.
All in all, I feel that this method of experiment would be very useful for future experiments and practicals I would be doing. For example, my group has decided to make a tea maker for CA1 and is halfway into completing the entire project. I strongly believe that using the design of experiment, we can trial-run the tea maker efficiently and see if it works. Additionally, I can also apply this during my internship at P&G as I would be in the research and development sector and I can utilize this when running experiments. This way of experiment can also be applied to past projects that I have done like the water filter challenge in year 1. It was also used in one of the earlier experiments where we experiment the effect of leaching with coffee.
No comments:
Post a Comment